Choosing a price for a subscription product is an essential, but often difficult, part of any publisher’s reader revenue strategy. Whether you are reconsidering the price of an existing product or have developed a new offering to share with your customers, choosing the right price is important for driving new acquisitions and retaining current subscribers.
There are usually several factors which influence the final price of a product, such as:
- Competitors in the market
- Acquisition and retention goals
- Costs and desired profit margins
- Target audience’s willingness to pay
Price sensitivity analysis is useful to understand the final point: what are your customers actually willing to pay for your product?
In a previous blog post, we’ve talked about how the Van Westendorp survey method can be used to find a product’s pricing sweet spot. The Van Westendorp method focuses on how customers perceive different prices, such as when a product becomes too cheap or too expensive. The output is a range of acceptable prices for a product.
In this blog post, we’ll discuss a different survey method called Gabor-Granger. Gabor-Granger focuses on understanding how much customers are willing to pay for a product within a range of predetermined price points. This means it is particularly useful for established products where you have a set price range in mind and want to test against these prices.
How to run a Gabor-Granger analysis
To begin a Gabor-Granger analysis, we need to decide on two things:
- A clear set of product features that are shown to customers before asking how willing they are to pay for the product
- A defined price range for the product which can be led by factors such as current price and competitors’ pricing – such as £40 to £120
Gabor-Granger relies on survey questions to understand customers’ pricing sensitivity. Within the survey, respondents are shown the contents of the package and then asked if they would be willing to pay a price in the middle of the set range.
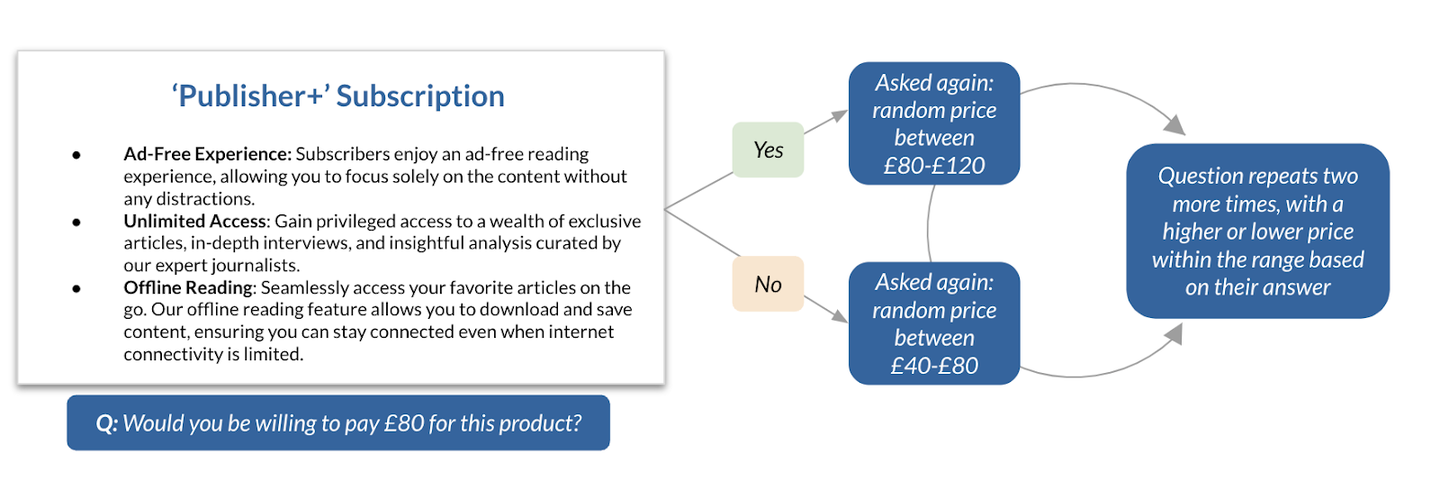
Depending on their response, they are asked the same question with a higher or lower price. They are asked a total of four times, and then are assigned a ‘last agreed price’ based on their answers. This last agreed price is used to plot a demand curve.
Results of the Gabor-Granger analysis
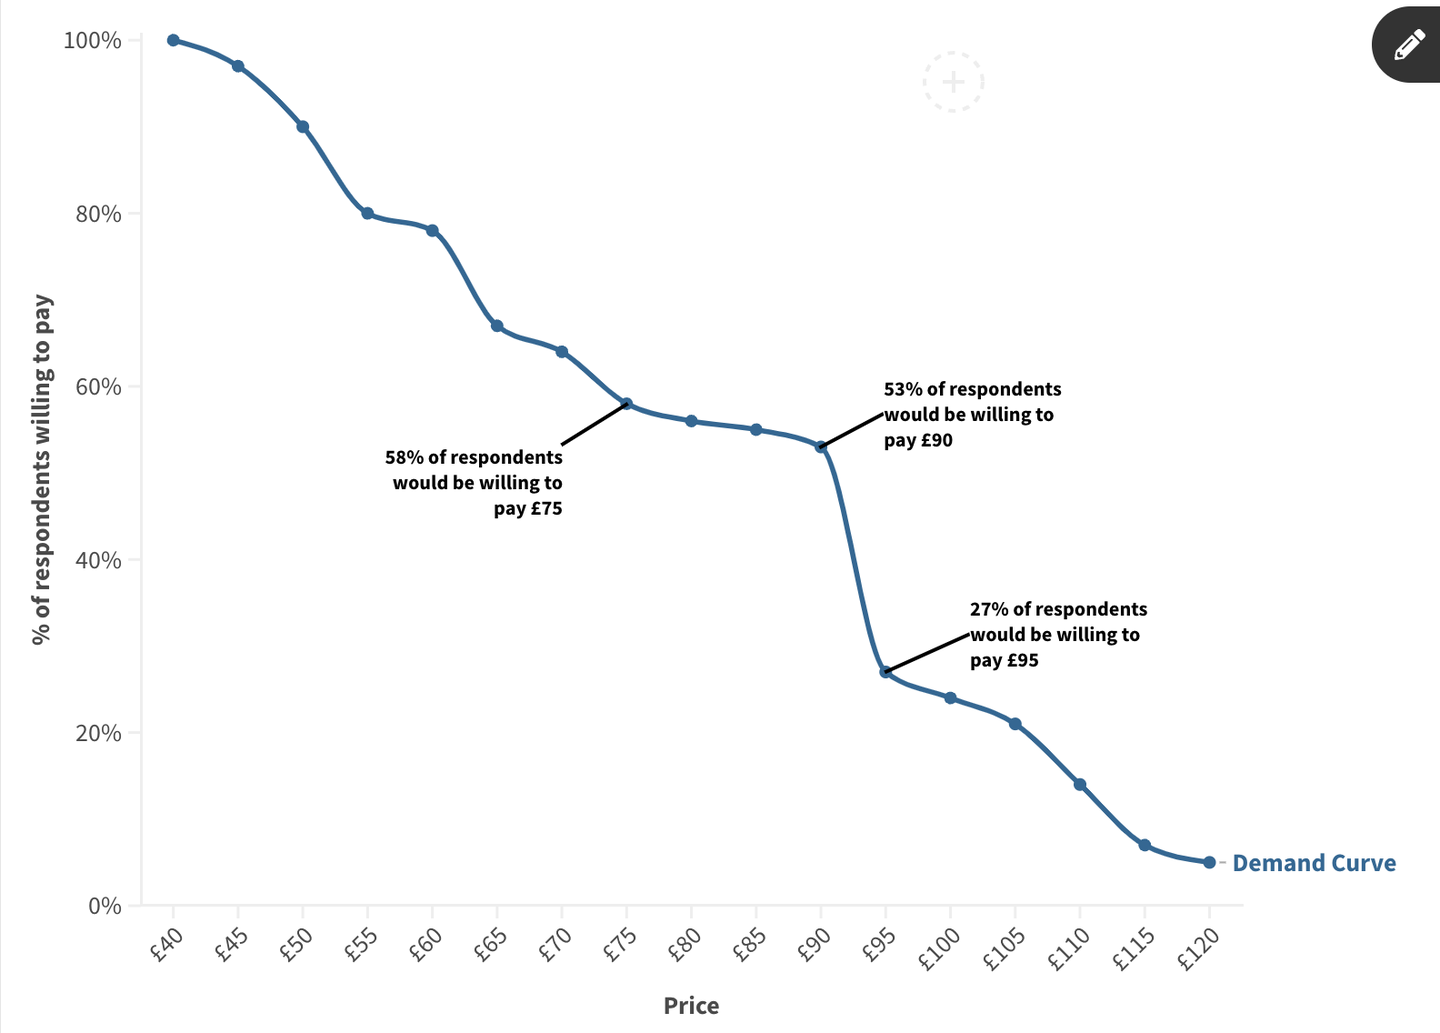
This demand curve shows the percentage of respondents who are willing to pay for the product at each price point. As the price increases, the percentage who are willing to pay decreases.
We can zoom in on areas of the demand curve to highlight key information about how sensitive customers are to changes in price.
- Where the curve is flatter, a price increase has little effect on demand. The graph above suggests that increasing the price from £80 to £90 would only slightly decrease demand.
- If the curve has a dramatic drop, there is a big decrease in demand at the new price. For instance, increasing the price from £90 to £95 causes demand to drop by 26 percentage points.
These data points are important: if we are considering pricing the product at £80, then we can assume that increasing the price to £90 will still maximise customer demand whilst increasing revenue. However, we also now know that if we choose a price over £90 then we risk losing out on many customers who would be willing to pay slightly less.
At FT Strategies, we also help publishers dig deeper into insights from Gabor-Granger, such as mapping revenue curves to understand which price points drive maximum revenue. We’re also able to compare the results of different segments, such as how much current subscribers are willing to pay compared to new subscribers, which is essential information for developing an acquisition and retention strategy.
Whatever the method, pricing sensitivity analysis fits into a wider framework for pricing strategy
Whether you choose Gabor-Granger or Van Westendorp, pricing sensitivity analysis is key for understanding customers’ willingness to pay and determining optimal pricing, and it fits into a wider pricing framework we offer at FT Strategies. We support publishers with building robust pricing strategies through a comprehensive approach, including competitor analysis to understand market dynamics and compare value, running focus groups to delve deeper into reader sentiment, and building out revenue projections based on our findings. If you’d like to learn more about how FT Strategies can support you with a pricing strategy for your products, please reach out to us here.
About the author